
Research Data Analysis: A Beginner's Guide for PhD Scholars

Data collection occurs throughout the research process through surveys, experiments, interviews, observations, and simulations, among others. However, data collection is just one aspect of the research process. Research data analysis is the stage in which observations collected during the research process are made sense of and used to make conclusions.
As stated in a 2024 report by Elsevier, researchers from around the world have produced more than 2.5 million scholarly articles in Scopus indexed journals within 2023, demonstrating the large amount of research evidence being created and analyzed across the globe.
Given the increasing number of research studies being conducted, being able to work with research data is now a crucial skill for PhD scholars. From data cleaning to choosing statistical methods and interpreting the findings, every decision you make during the analysis process will affect your results.
This guide will introduce you to the basics of data analysis for research.
What Is Research Data Analysis?
Research data analysis refers to the organisation, examination and interpretation of data obtained in order to generate meaningful information, draw answers to the research questions and make evidence based conclusions.
It is the step where the raw data becomes useful research evidence. Analysis might include such activities as:
- Cleaning the data
- Finding patterns and connections
- Using qualitative or quantitative methods
- Hypotheses testing
- Interpretation and presentation of results
For instance, an analysis of the student performance could be carried out by analysing the test scores, absenteeism rate, and surveys. In case of interviews, researchers will look at the recurrent themes and participants' experience.
The main idea is that the data analysis in research is not the general procedure, but rather the technique which varies depending on the nature of your research question and research.
Why Is Data Analysis Important for PhD Scholars?
For a PhD scholar, data analysis is more than a technical step between data collection and writing the thesis. It is the stage where evidence begins to support the research argument.
Good analysis can help you:
Answer Your Research Questions
Your research questions establish what you want to investigate. Analysis helps you determine what your collected evidence reveals about those questions.
Test Your Hypotheses
When there are hypotheses in your research, the use of proper statistics can help in determining whether the data support or refute the hypotheses.
Recognize Patterns and Associations
Statistics will also enable you to recognize associations that cannot be observed through the observation of the individual pieces of evidence.
For instance, the research can show that two variables are associated or are not associated as was expected.
Formulate Defensible Conclusions
As opposed to basing your conclusions on assumptions, you can formulate defensible conclusions based on analyzed evidence.
Strengthen Your Thesis
A well-planned analysis connects your methodology, results, discussion, and conclusions. This creates a clearer research narrative.
In other words, statistical analysis in research is not simply about producing tables full of numbers. It is about using appropriate evidence to address a research problem.
Types of Research Data You May Work With
Before considering a method of analysis, one should determine what data he/she has.
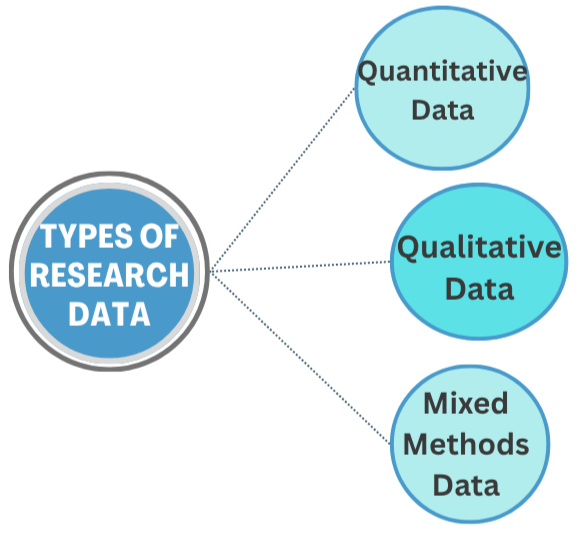
1. Quantitative Data
Quantitative data refers to numbers that can usually be measured or counted.
This data can be illustrated by:
- Exam grades
- Age
- Money earned
- Temperature
- Surveys
- Experiments
One can use statistical methods in order to analyze quantitative data.
2. Qualitative Data
Qualitative data refers to meanings, experiences, perceptions and descriptions rather than measurements of numbers.
This data includes:
- Interviews
- Focus groups
- Surveys with open-ended questions
- Fieldnotes
- Observation data
- Documents
The researcher can code this data and find some repeating concepts.
3. Mixed Methods Data
Some PhD research uses both quantitative and qualitative approaches.
For instance, the researcher conducts a survey to obtain numerical data and an interview to gain more insight into people's experience.
When conducting mixed-methods research, the researcher has to think about how to analyze this data.
A Step-by-Step Research Data Analysis Process
When you finish with data collection, what step should you take? The following is a helpful guide for you.
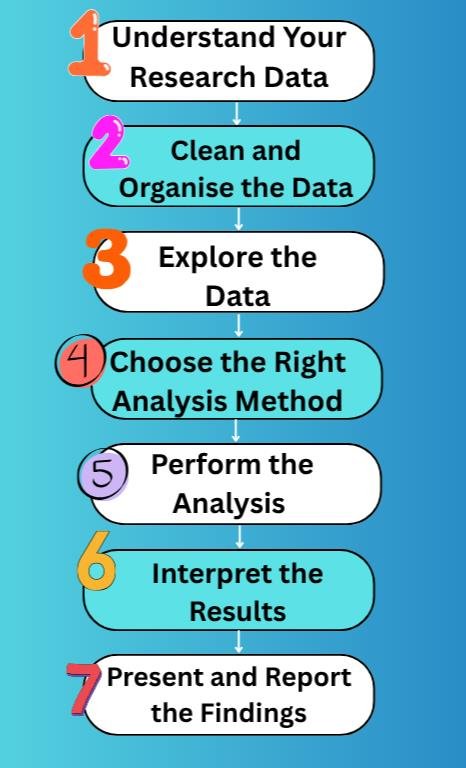
Step 1: Understand Your Research Data
Before you use SPSS, Python, MATLAB, or Excel software, know what you are working with.
You should ask yourself the following:
- What variables or categories are there?
- What does each variable mean?
- How does your data answer each research question?
- Is the measurement uniform?
- What kind of data does each variable include?
This step might seem to be elementary, yet it will save you from many headaches ahead.
Step 2: Clean and Organise the Data
Any raw data is bound to contain some mistakes.
The mistakes may include:
- Missing values
- Duplicate records
- Typing errors
- Non-uniform categories
- Incorrect values
- Surprising observations
Cleaning the data will help you get a good dataset ready for further analysis.
For instance, if gender is represented by "Male", "male", "M", and "MALE", you will probably need to clean those values before you analyse this variable.
Do not rush to skip the cleaning part just because you cannot wait to obtain your results. Mistaken data is likely to give you misleading conclusions.
Step 3: Explore the Data
Let us now consider the first step which consists of understanding what the contents of the data set are. In case of quantitative data, this can be done by looking at:
- Frequencies
- Percentages
- Mean
- Median
- Standard Deviation
- Minimum & Maximum Values
- Distribution
Graphs and plots like the bar plot, histogram, and scatter plot can also help you detect any pattern or anomalies.
The process described above is referred to as exploratory data analysis.
Step 4: Choose the Right Analysis Method
As your data is now clean and organized, it is time to decide which method you should use to analyze it.
Do not select any technique merely because it is trendy or offered in your statistical software. Instead, begin with the following considerations:
Research question → Data type → Research design → Assumptions → Suitable method
For example:
| Research objective | Possible method |
|---|---|
| Summarise data | Descriptive statistics |
| Find relationships | Correlation |
| Compare two groups | t-test |
| Compare multiple groups | ANOVA |
| Predict an outcome | Regression |
| Examine categorical associations | Chi-square test |
It all comes down to your specific research question, variables, study design and assumptions. Learning how to conduct statistical methods in research is far more important than remembering specific statistical tests.
Step 5: Perform the Analysis
Now that you've chosen the appropriate method, it's time to start working with your data through a suitable software.
Popular choices include:
- SPSS: Ideal for conducting statistical analysis via a user-friendly graphical interface.
- Python: Useful for data cleaning, statistical analysis, visualizations and complex analysis.
- MATLAB: MATLAB data analysis is useful for mathematical operations, simulations, modelling, and other technical research.
- Excel: Ideal for organising your data, conducting calculations and basic analysis.
For instance, if you choose to work with SPSS data analysis, it will be ideal for researchers who prefer to work with menus instead of code. In the same manner, Python for research data analysis becomes much more flexible when it comes to researchers who can program.
However, your goal shouldn't be the most sophisticated tool available. Choose the one that is appropriate for you.
Step 6: Interpret the Results
Running an analysis is only part of the job. The more important question is: What do the results actually mean?
Your interpretation should connect the findings with:
- Research questions
- Hypotheses
- Variables
- Theoretical framework
- Previous research
- Study limitations
For instance, in a statistical result, a significant relationship between two variables may be obtained. Rather than just presenting the significance, explain what the relationship means in the context of your study.
Software generates results; however, it is researchers who interpret them. Be careful not to make claims that are beyond what your results and research design support.
Step 7: Present and Report the Findings
Your final step is communicating the results clearly.
Depending on your research, you may use:
- Tables
- Graphs
- Charts
- Statistical summaries
- Thematic descriptions
- Narrative explanations
Do not overload your thesis with every output generated by your software.
Instead, present the results that help answer your research questions and explain them clearly.
A reader should not have to decode a complicated statistical table just to understand your main finding.
Common Mistakes PhD Scholars Should Avoid
However, even carefully designed studies can face certain challenges during the analysis. The following errors should be avoided during the analysis process:
- Selection of the Method too Quickly: One should start analyzing the problem and select a proper methodology based on the research problem rather than based on the statistics test.
- Omission of Data Cleansing: Missing data, duplicate records, and inconsistencies may impact the outcomes.
- Overuse of the Statistical Techniques: It is important to remember that more statistical techniques do not necessarily result in high-quality research. Select only the methods that can be used for the accomplishment of the objectives.
- Use of Software Outputs Instead of Research Judgements: The software like SPSS, Python, or MATLAB can calculate things; however, it cannot make a research judgement.
- Conflation of Correlation and Causation: A correlation of two variables does not mean that there is causation.
- Ignoring Statistical Assumptions: It is necessary to check whether the selected methods are appropriate in this case.
- Providing Raw Data: It is not enough to report results. One should interpret them based on the research questions.
Thus, careful consideration of these issues will help to conduct an analysis correctly.
Final Thoughts
For a PhD scholar, research data analysis can initially feel like the most technical and intimidating part of the research journey. But it becomes much easier when you stop viewing it as simply "running statistics" and start seeing it as a structured way of asking questions of your evidence.
Begin with your research questions. Understand your data. Clean it carefully. Examine its contents. Choose the proper way of analysis, examine the evidence and interpret your findings.
Use whatever computer program you like to analyze your data, but don't forget the fact that this program is merely an instrument, the researcher is the one who thinks.
Good research data analysis does not merely produce numbers or outputs. It helps turn collected evidence into findings that your readers can understand, evaluate, and connect with your research objectives.
Frequently Asked Questions
1. What is research data analysis in a PhD?
Research data analysis refers to the organizing, investigating, analyzing, and interpretation of data gathered within the context of conducting a PhD research study.
2. What are the statistical tools that are used in research?
Some of the commonly used statistical tools include descriptive statistics, correlation, regression, t-test, ANOVA and Chi square. However, it will depend on the research question and nature of the research itself.
3. Is SPSS useful for conducting PhD research?
Yes, SPSS can be useful for PhD research, especially where researchers conduct statistical analysis without coding.
4. Can Python be utilized to analyze data for research purposes?
Yes. Python can provide tools for data cleaning, statistics, visualization, modeling and other processes required in research. It can be especially helpful for those researchers who possess skills in programming or require a great flexibility in their data analysis.
5. How do I select an appropriate method for analyzing data in my research?
Think of your research question first and determine the type of data and research methodology used. Then think of the variables, assumptions and the purpose of the analysis in order to choose an appropriate method. If required, consult a statistician or research methods specialist instead of choosing a test based only on software capabilities.